The record behind the number.
Temprix turns what each person is available for into a single coverage number per team. When that number comes in lower than you need, these reports open it back up, at whatever scope the question needs: a whole team over a quarter, one person's year, or the individual events behind either. Every figure reads the same data that produced the number, so there is nothing to reconcile.
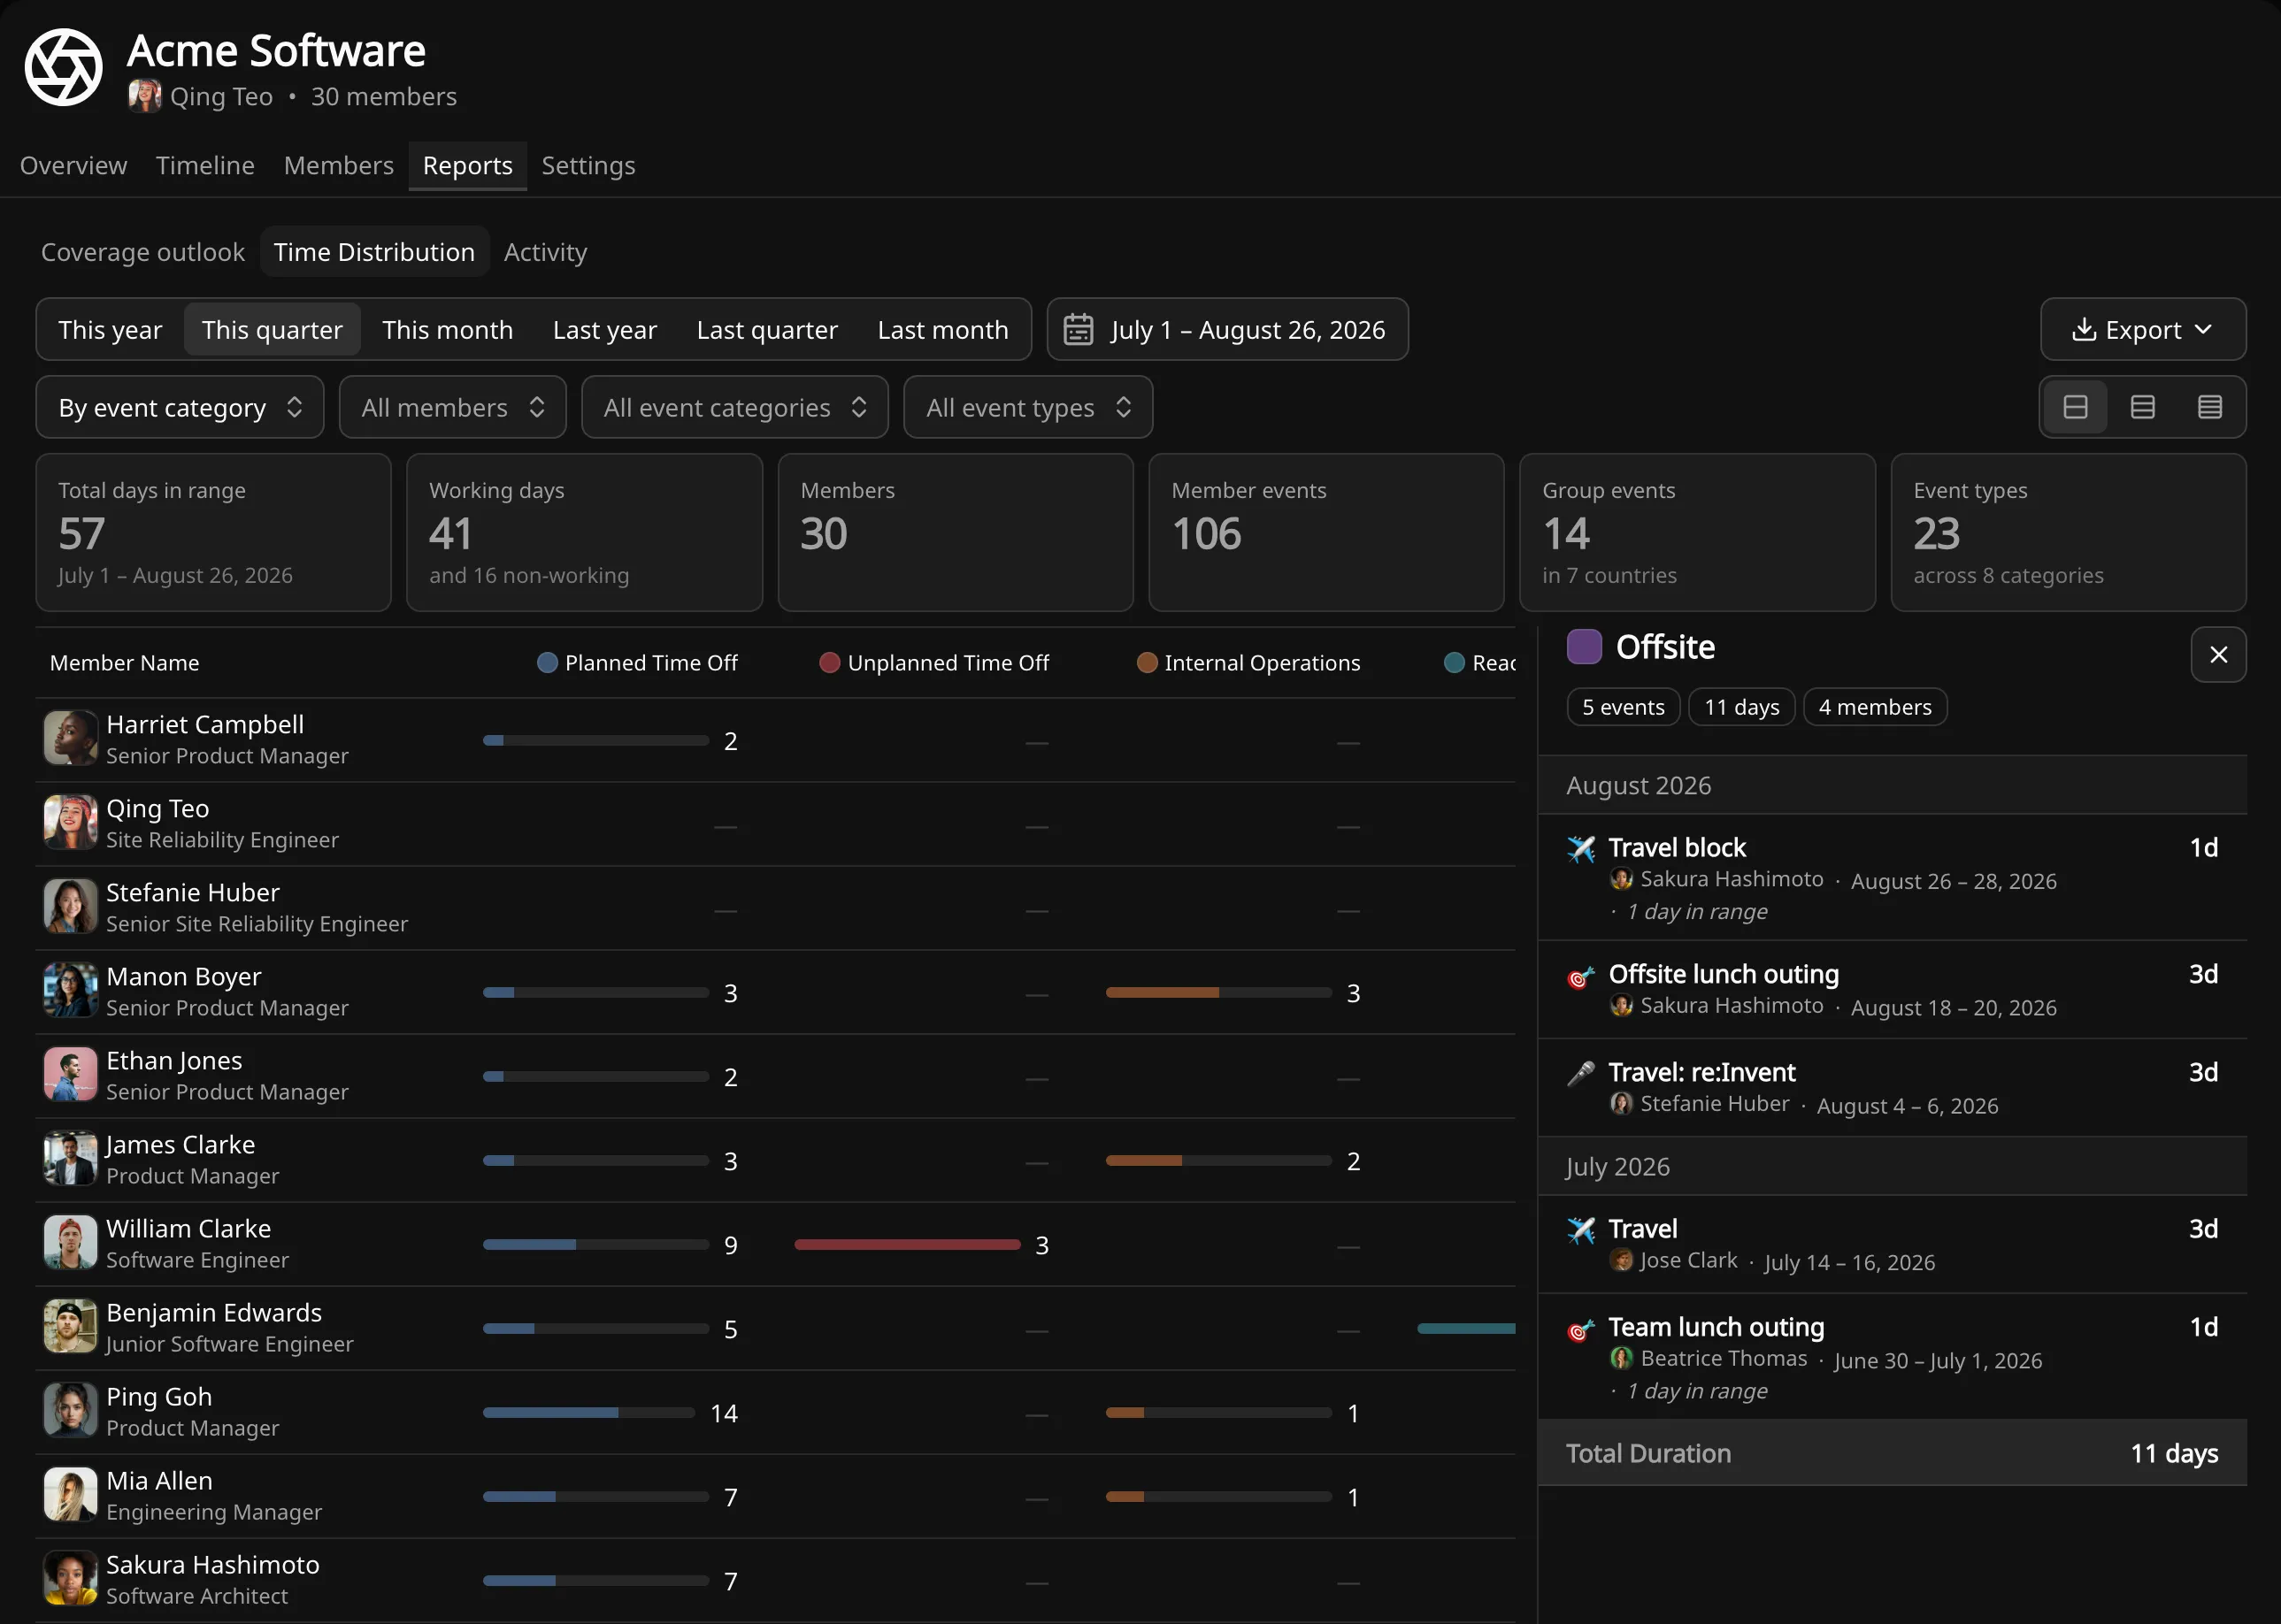
How a period was spent, member by member.
A team report covering any period, with one row per member and one column per grouping. Group by event category, by individual event type, or by time type to separate primary work from secondary activity and non-working days. It answers what a shortfall was made of, rather than how large it was.
- Group by event category, event type or time type
- Filter to selected members, categories or types across any date range
- Open any figure for the events behind it, whether it is one member's or a whole team's total
- Bars share a scale down each column, so one member's load reads against another's without comparing numbers
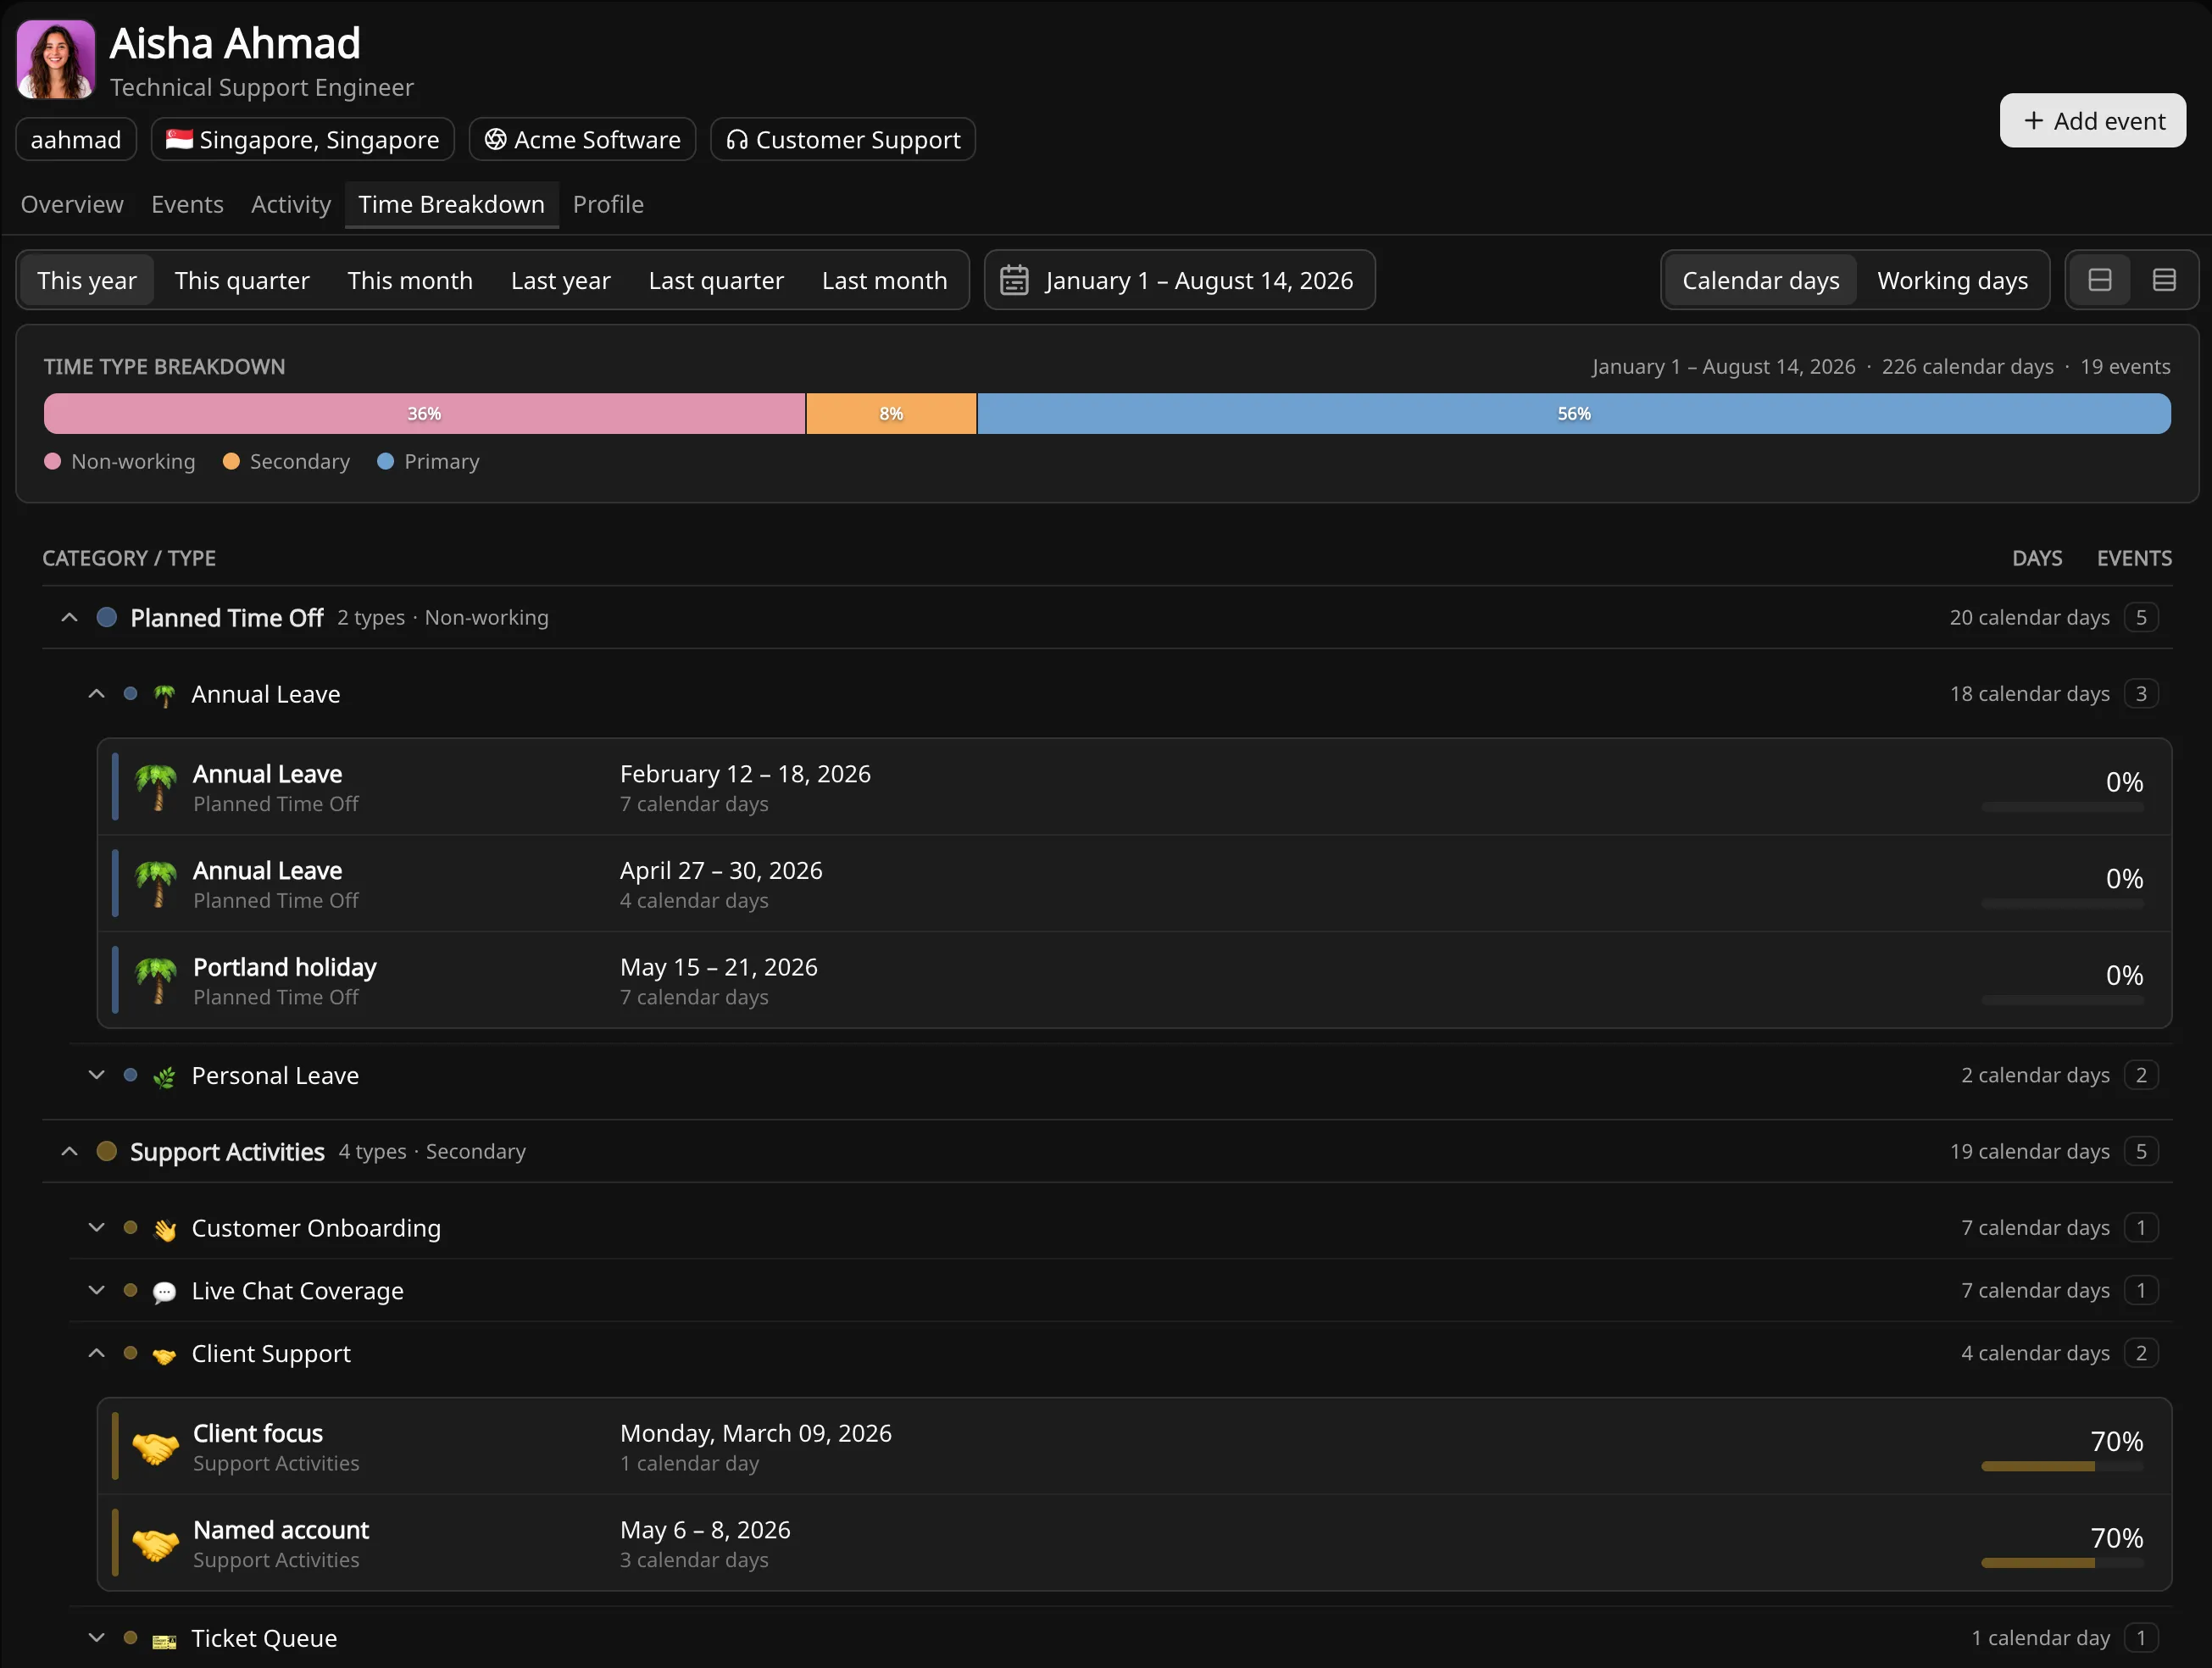
One person, from the whole period down to a single day.
The same question narrowed to one member, on their own profile. Useful in one-to-ones, and where an uneven distribution of secondary activity needs to be shown rather than described.
- See the split between primary work, secondary activity and non-working time, with details in a tooltip
- Every level carries its own day and event count, so you can stop at whatever depth answers the question
- Counted in calendar days or working days
- Each event shows the availability it contributed, so a half-available day is not counted as a whole one
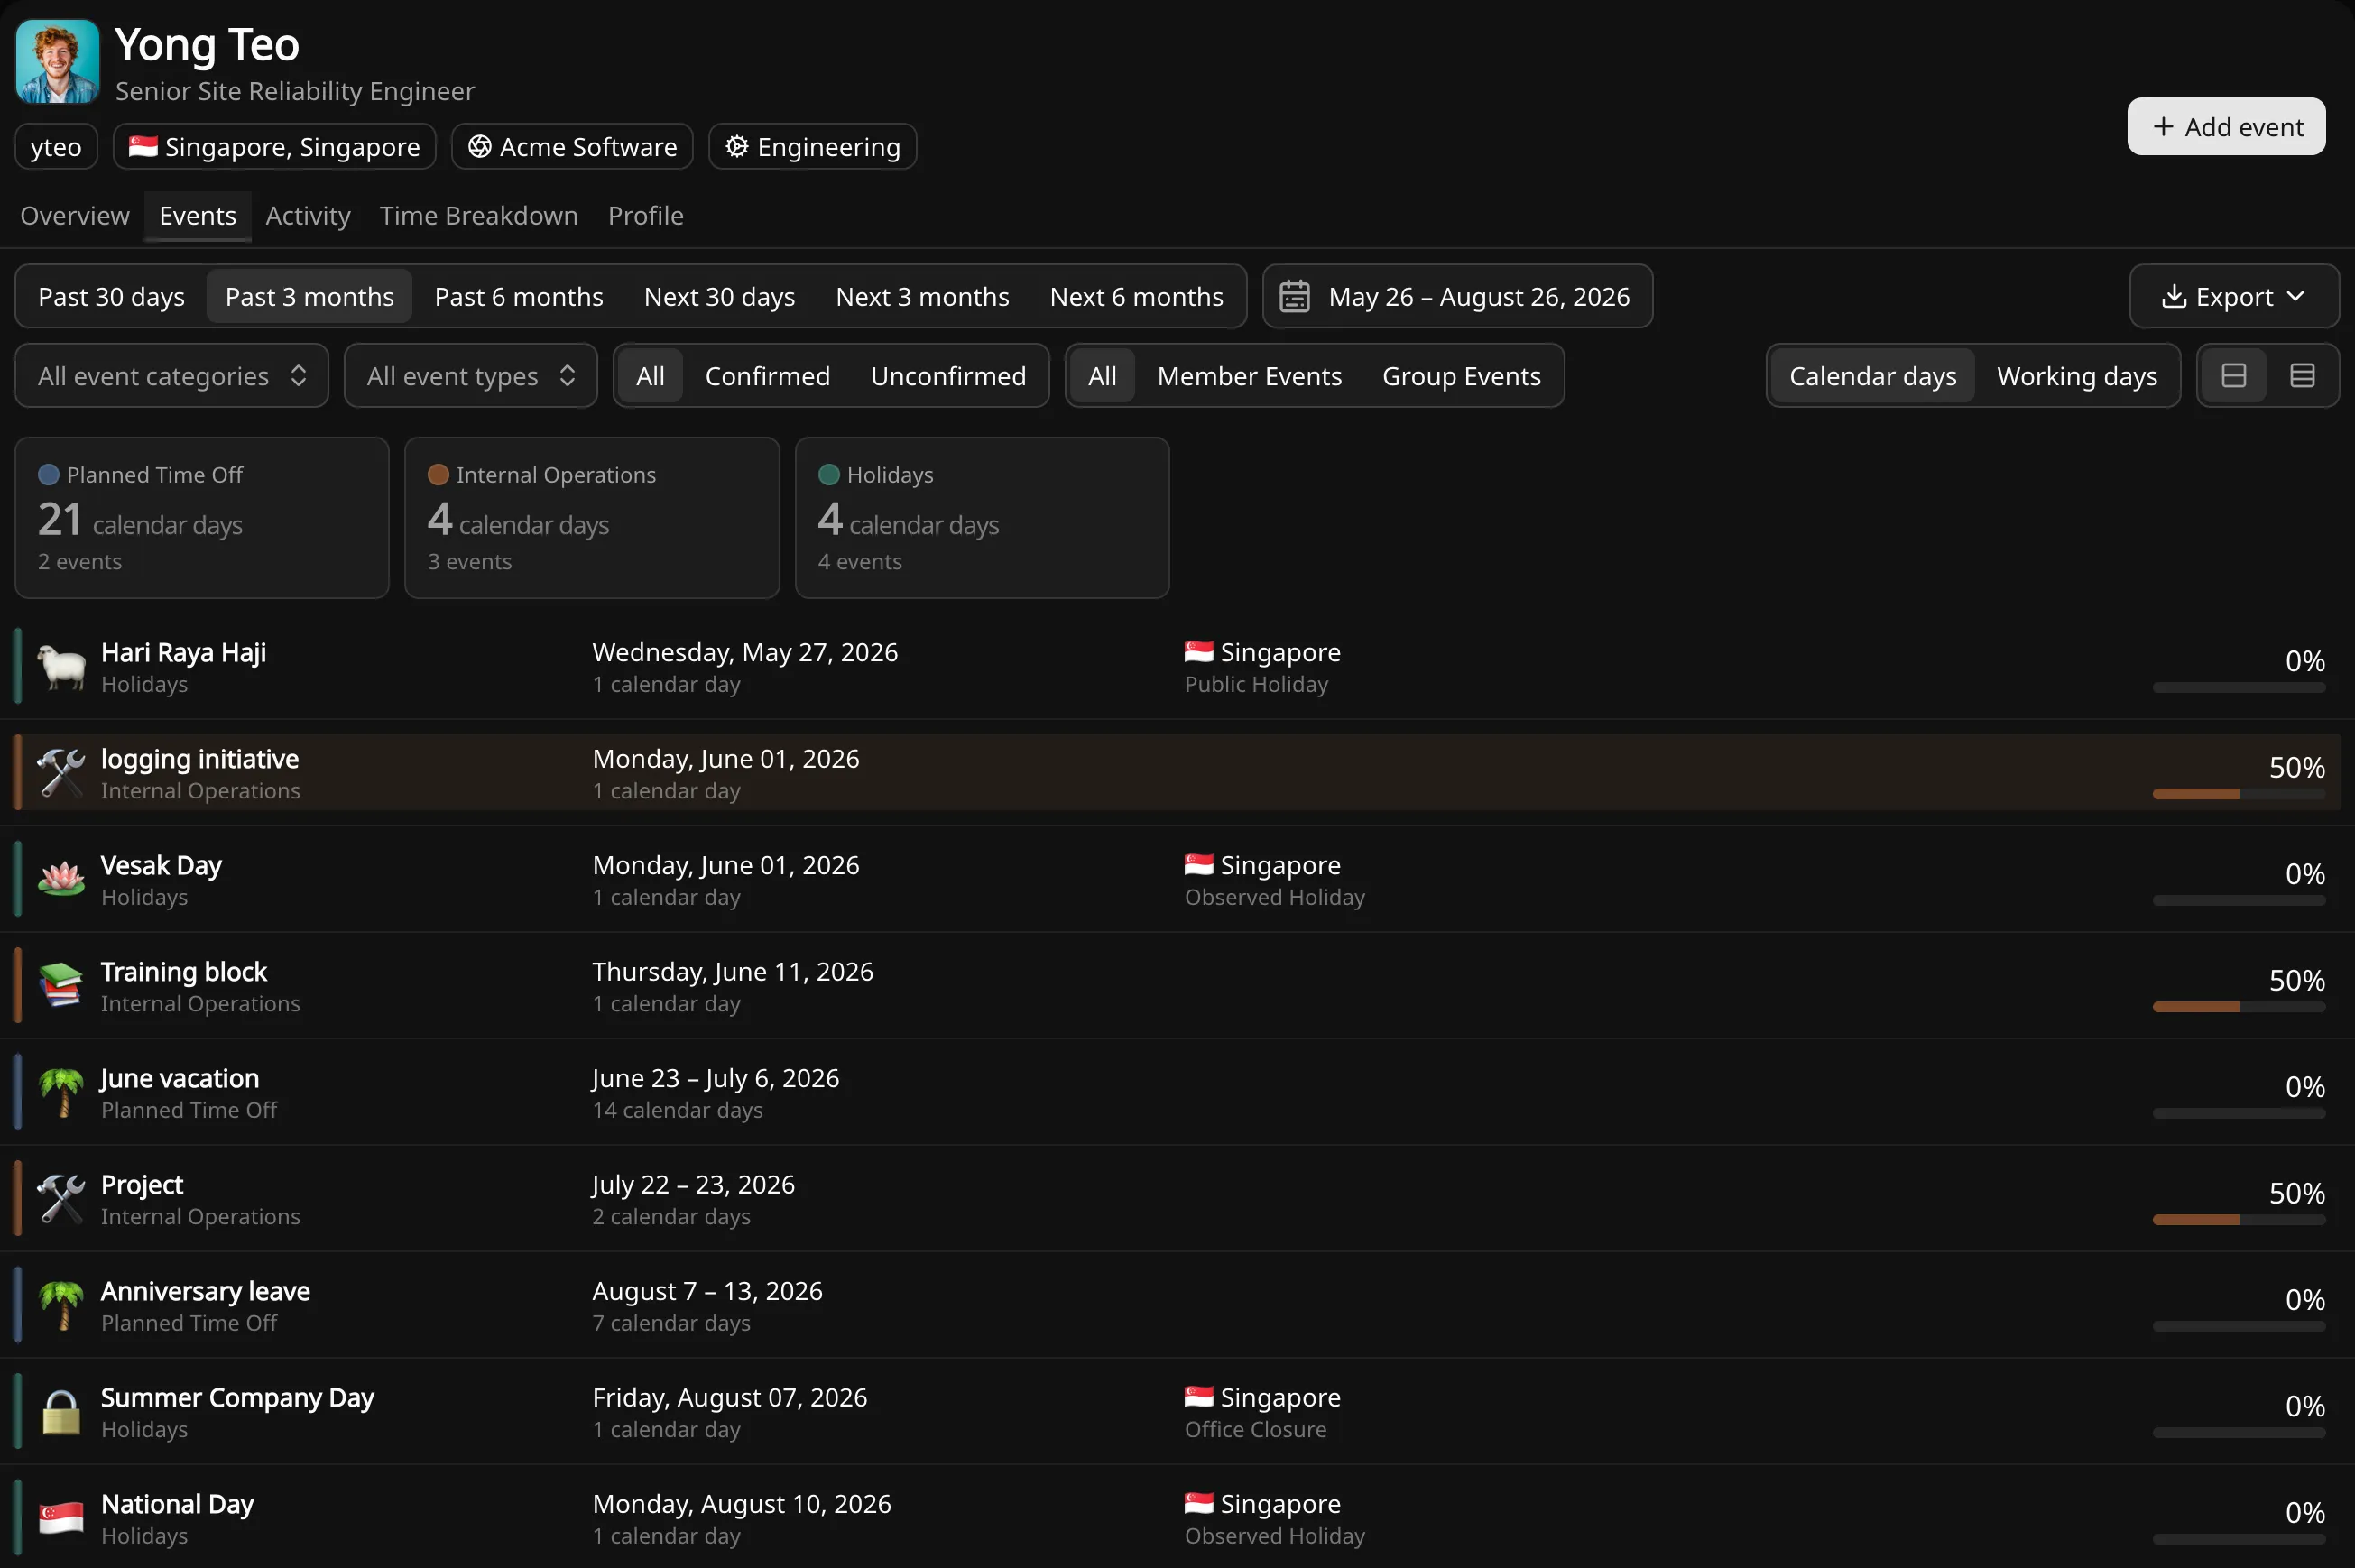
The individual records, backward and forward.
Every figure in the other reports is an aggregate of individual events, and this is the list that produced them for one member. It runs from the past six months to the next six, so the same view answers what happened and what is already booked.
- Member events and group events in one list
- Category totals across the top: days and events per category for the range in view
- Unconfirmed events shown as such, so tentative plans are visible without being counted on
- Filter by category, type, kind and range, then export exactly that view
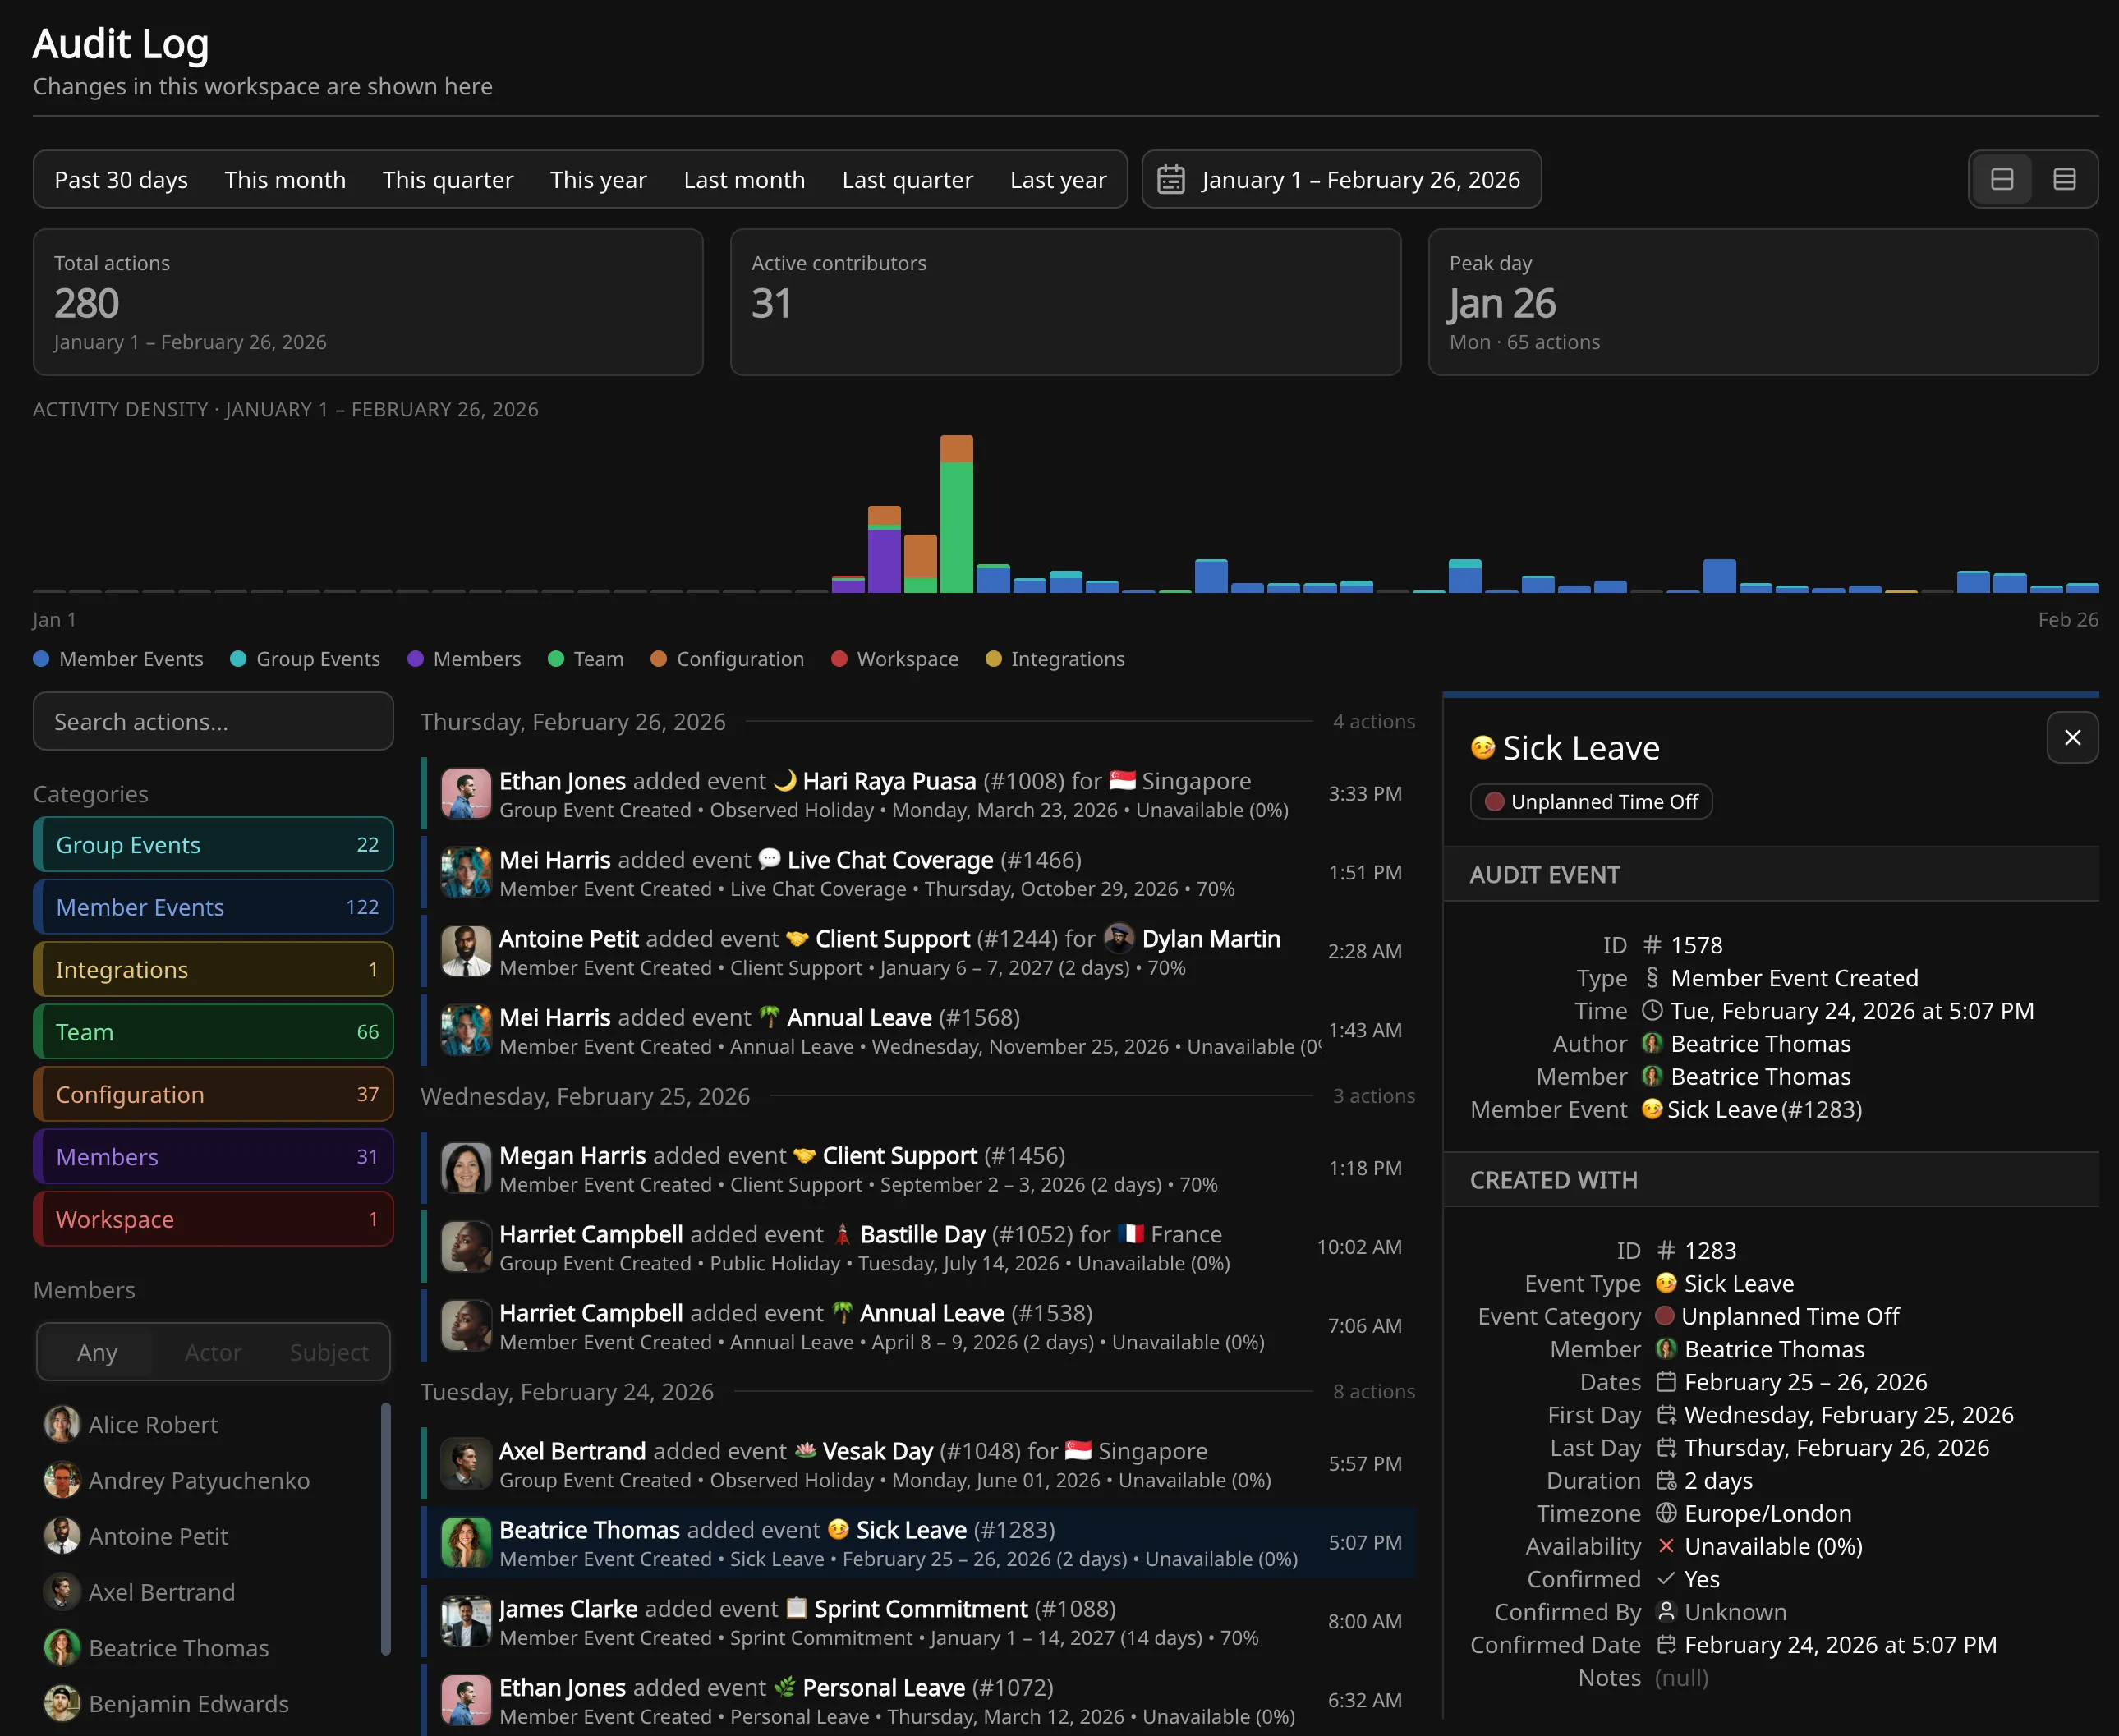
What changed, who changed it, and what it was before.
Availability data is personal data, and changes to it are recorded. Creates, updates and deletes across members, events, teams, event types, alert rules and workspace administration are written to an audit log. The same log is read at three levels: the whole workspace, a single team, or one member.
- Updates record the previous value alongside the new one, not just the fact of a change
- Filter a person as the actor or as the subject, separately
- Read at workspace, team or member level, over any date range
- Filter by domain: member events, group events, members, configuration
- Retention is listed per plan on pricing
None of it is locked in here.
Two ways out, depending on who is asking. A file when someone needs it in a spreadsheet, and the API when another system needs to read Temprix on a schedule.
- CSV export carries the events behind the figures, not just the totals
- A GraphQL API over the same schema the product runs on, so anything a report shows can be read programmatically
- API keys are individually revocable and carry the permissions of the member who created them, so an integration never sees more than its owner
The reports you already open also leave the product: CSV with the filters applied, and a GraphQL API over the same schema.
Find out how many people you'll really have on the 14th.
Free for up to 10 people. No credit card.