

Coverage Outlook
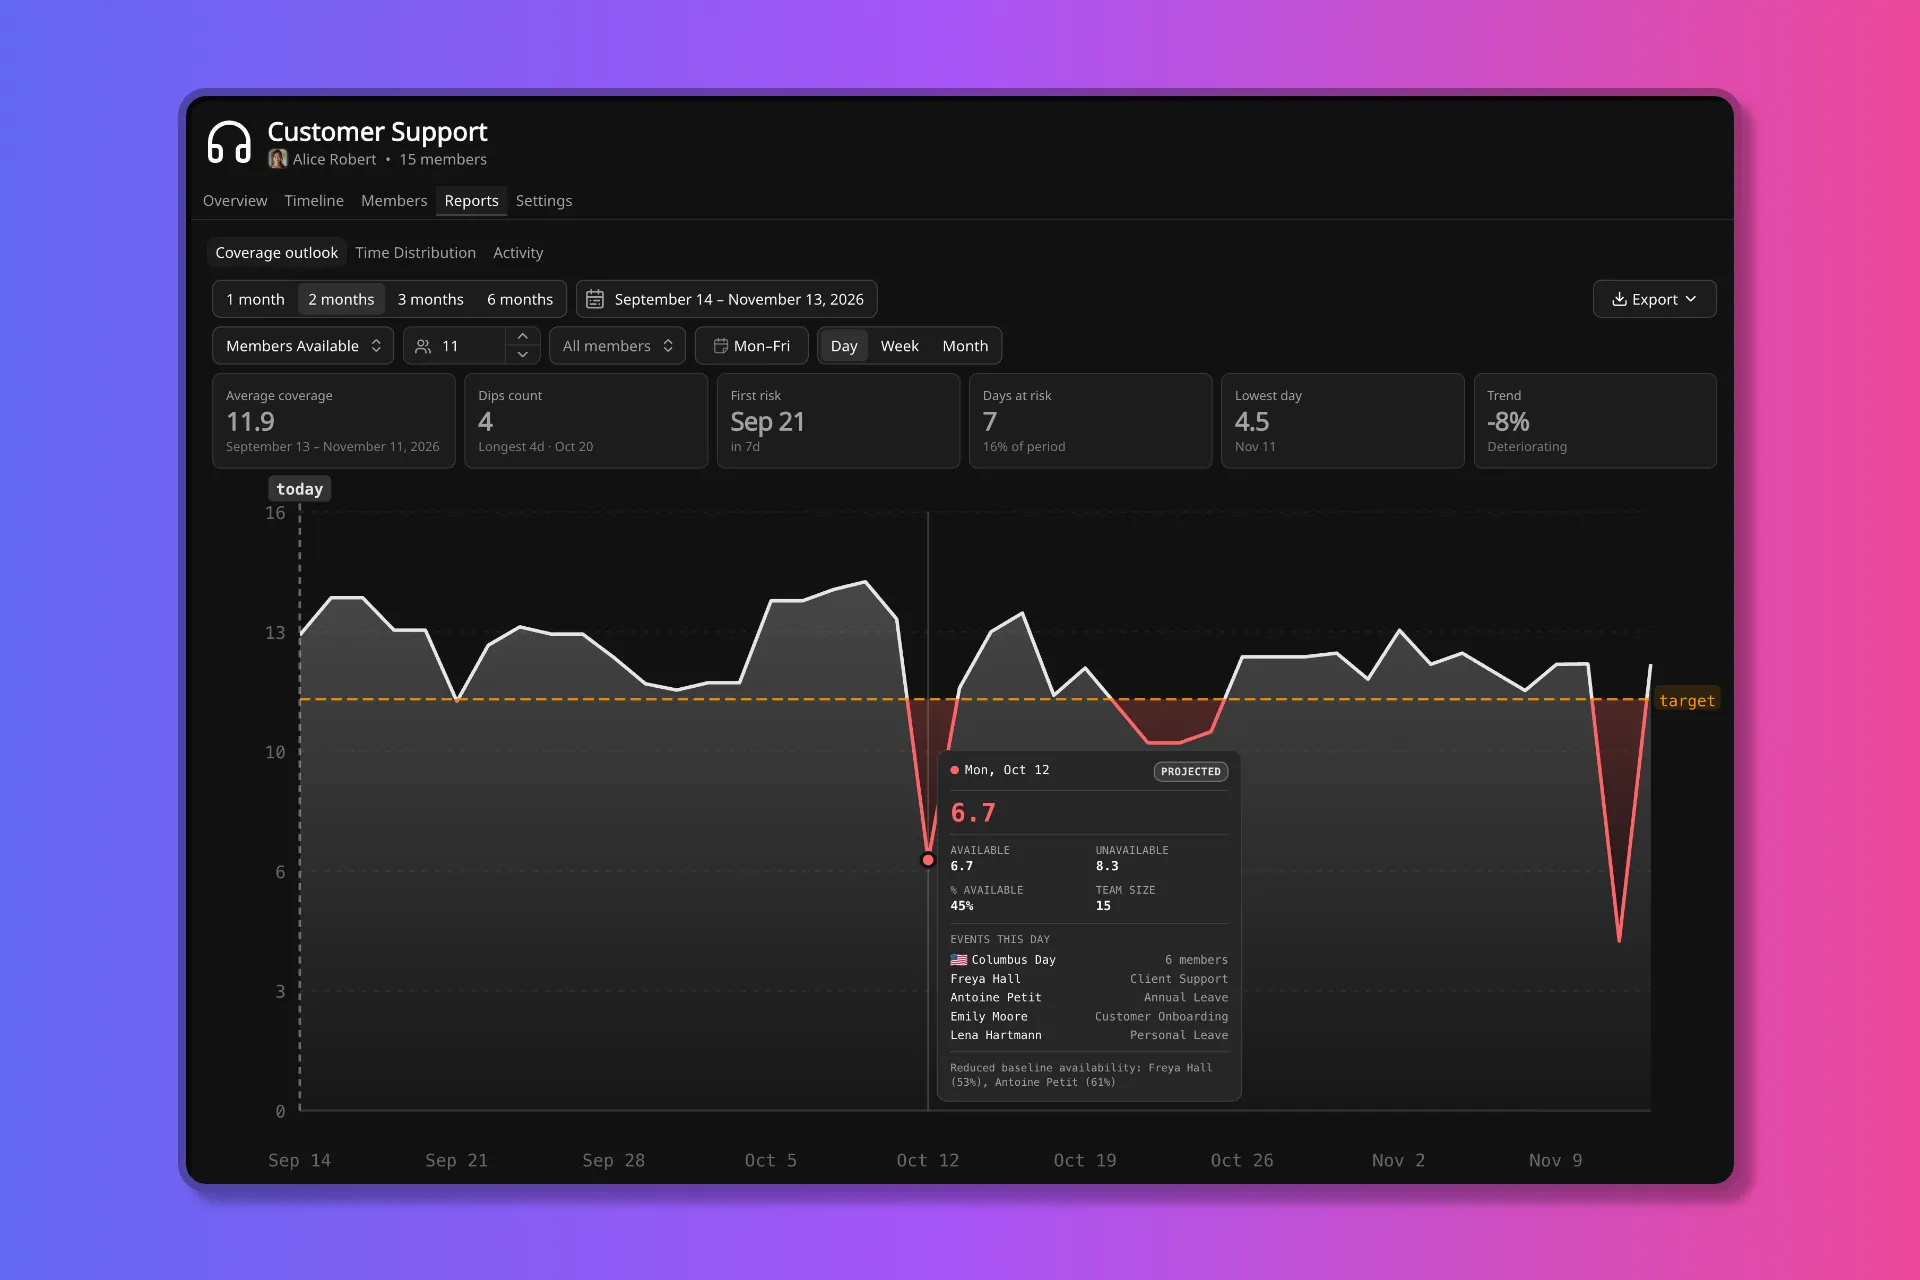
Coverage Outlook plots how many people you will have on each day, against a numeric target.
It is forward-looking. Read today and the days ahead. Do not use this report to study past coverage. For where time went, use Time Distribution. For a member’s events in a past range, use their Events report.
Availability is a share of one person’s time. Coverage is that figure added up, in people. How the number is produced is on How coverage is calculated.
Open the report
Section titled “Open the report”Open a team, then Reports. Coverage outlook is the default tab.
From Overview, View coverage outlook report → opens the same report with the team’s stored target. If the team has no target, Overview points you at Team Settings instead. You can still open the report from Reports and set a target there for this view only.
What you can change
Section titled “What you can change”You can pick a period (presets starting this week, or an explicit range), which members to include, which weekdays to plot, and whether each point is a day, a week, or a month. Week and month values are the average of the plotted days in that bucket.
The metric is display only. Members Available is the coverage figure itself. The other modes are the same number as a gap, a percentage, or a delta against the target. They are listed on How coverage is calculated.
The target is a reference line for this view, in people. Changing it here does not change coverage, and it does not write back to Team Settings.
The weekday control only chooses which days appear on the chart and in the insight cards. It does not change anyone’s working week.
Insight cards
Section titled “Insight cards”The cards summarise today and the projected days, on the weekdays you are plotting. Days behind today can still appear on the chart. They do not enter the cards.
A dip is coverage below the target, counted in people, even if you are viewing % Available.
Hover a point for that day’s coverage and the events that reduce it. Member events and group events
share one list. Events at 100% availability still count in the headline and do not appear in the
list. Members with a reduced baseline are listed separately under the
events.
Export
Section titled “Export”Export can download the plotted series, plus the member events and group events in the range,
as a CSV. The same forward series is available through
coverageOutlook.
Where to go next
Section titled “Where to go next”- How coverage is calculated is the number this report plots.
- How availability works is where baselines, working weeks, and events come from.
- Coverage alerts email you when coverage drops on a schedule.